Geospatial Intelligence

AI-Powered Spatial Analytics

1

Active Layers

4

Map Views

Global

Coverage

2.4M

Data Points

98.7%

Accuracy

Live

Updates

Data QualityExcellent
1 selected: Carbon & Climate
Viewing:Carbon & Climate
Impact Level
Best
Good
Mod
High
Severe
Critical
carbon View
Generating SWOT analysis...

Country Comparison

Carbon & Climate

Top Performers

Click for details

1Denmark
92

Reduced emissions by 46% since 2000; high investment in renewable energy grid integration.

2Portugal
89

Significant shift to renewable energy sources and 37.6% reduction in emissions since 2000.

3United Kingdom
88

Achieved 42.2% reduction in emissions since 2000 through aggressive decarbonization policies.

4Sweden
87

Maintains low per capita emissions of 3.57 tons and strong commitment to net-zero targets.

5Switzerland
86

Low per capita emissions of 3.75 tons with a highly efficient, low-carbon energy economy.

Needs Improvement

Click for details

1Palau
15

Highest per capita emissions globally at 82.84 tons due to heavy reliance on fossil fuels.

2China
25

World's largest emitter at 12.72 billion tons; emissions increased 265% since 2000.

3United States
35

Largest historical emitter; current annual emissions remain high at 4.78 billion tons.

4India
38

Emissions grew 224% since 2000, reaching 2.87 billion tons annually.

5Russia
40

High total emissions of 1.95 billion tons with slow progress on carbon intensity reduction.

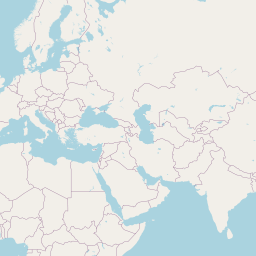
Carbon & Climate
heatmap

Global carbon emissions reached record highs in 2024 despite ongoing efforts to transition energy.

  • •Fossil fuel emissions rose to 37.4 billion tonnes.
  • •Total annual CO2 emissions reached 41.6 billion tonnes.
  • •Remaining carbon budget for 1.5C is nearly depleted.
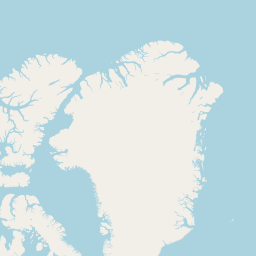
Forests & Biodiversity
satellite

Forests sustain most terrestrial biodiversity while regulating essential global climate and water cycles.

  • •Global tree cover loss reached record highs 2024.
  • •Deforestation rates remain significantly off 2030 targets.
  • •Climate-driven wildfires increasingly threaten high-biodiversity forest ecosystems.
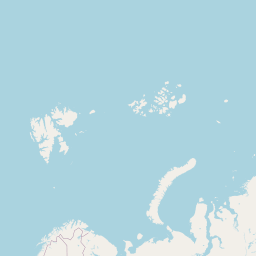
Natural Resources
terrain

Natural resources are essential materials extracted from Earth to support global economic and human activity.

  • •Global material extraction reached 106.6 billion tonnes.
  • •Resource consumption is projected to rise significantly.
  • •High-income nations consume six times more resources.
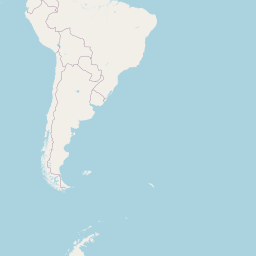
Sustainability
Map

Sustainability involves meeting current needs without compromising the ability of future generations to thrive.

  • •Only 17 percent of SDG targets remain on-track.
  • •Global material consumption continues to rise significantly.
  • •Progress on most environmental goals has stalled.
National Treasures
heatmap

How to Use This Application

Practical use cases and capabilities, authored by Sufi Khan Sulaiman

Interactive Mapping and Visualization

The Geospatial application provides interactive maps for visualizing location-based data, from demographic distributions to infrastructure networks. Analysts, urban planners, and researchers can overlay datasets onto maps to uncover spatial patterns invisible in spreadsheets.

Country and Region Comparison

Compare metrics across countries and regions side by side, with detailed modal views for each location. This is invaluable for market research, academic studies, and policy analysis where understanding geographic variation drives decision-making.

Predictive Analytics and Anomaly Detection

Leverage built-in predictive analytics modules to forecast trends and detect anomalies in geospatial data. Businesses can identify emerging markets, governments can spot infrastructure issues, and researchers can model climate or population changes.

Infrastructure and Asset Mapping

Map physical assets, infrastructure, and resources with custom data layers. Utility companies, logistics teams, and real estate professionals can visualize networks, plan routes, and assess coverage areas with precision and clarity.

Content by Sufi Khan Sulaiman — 2026